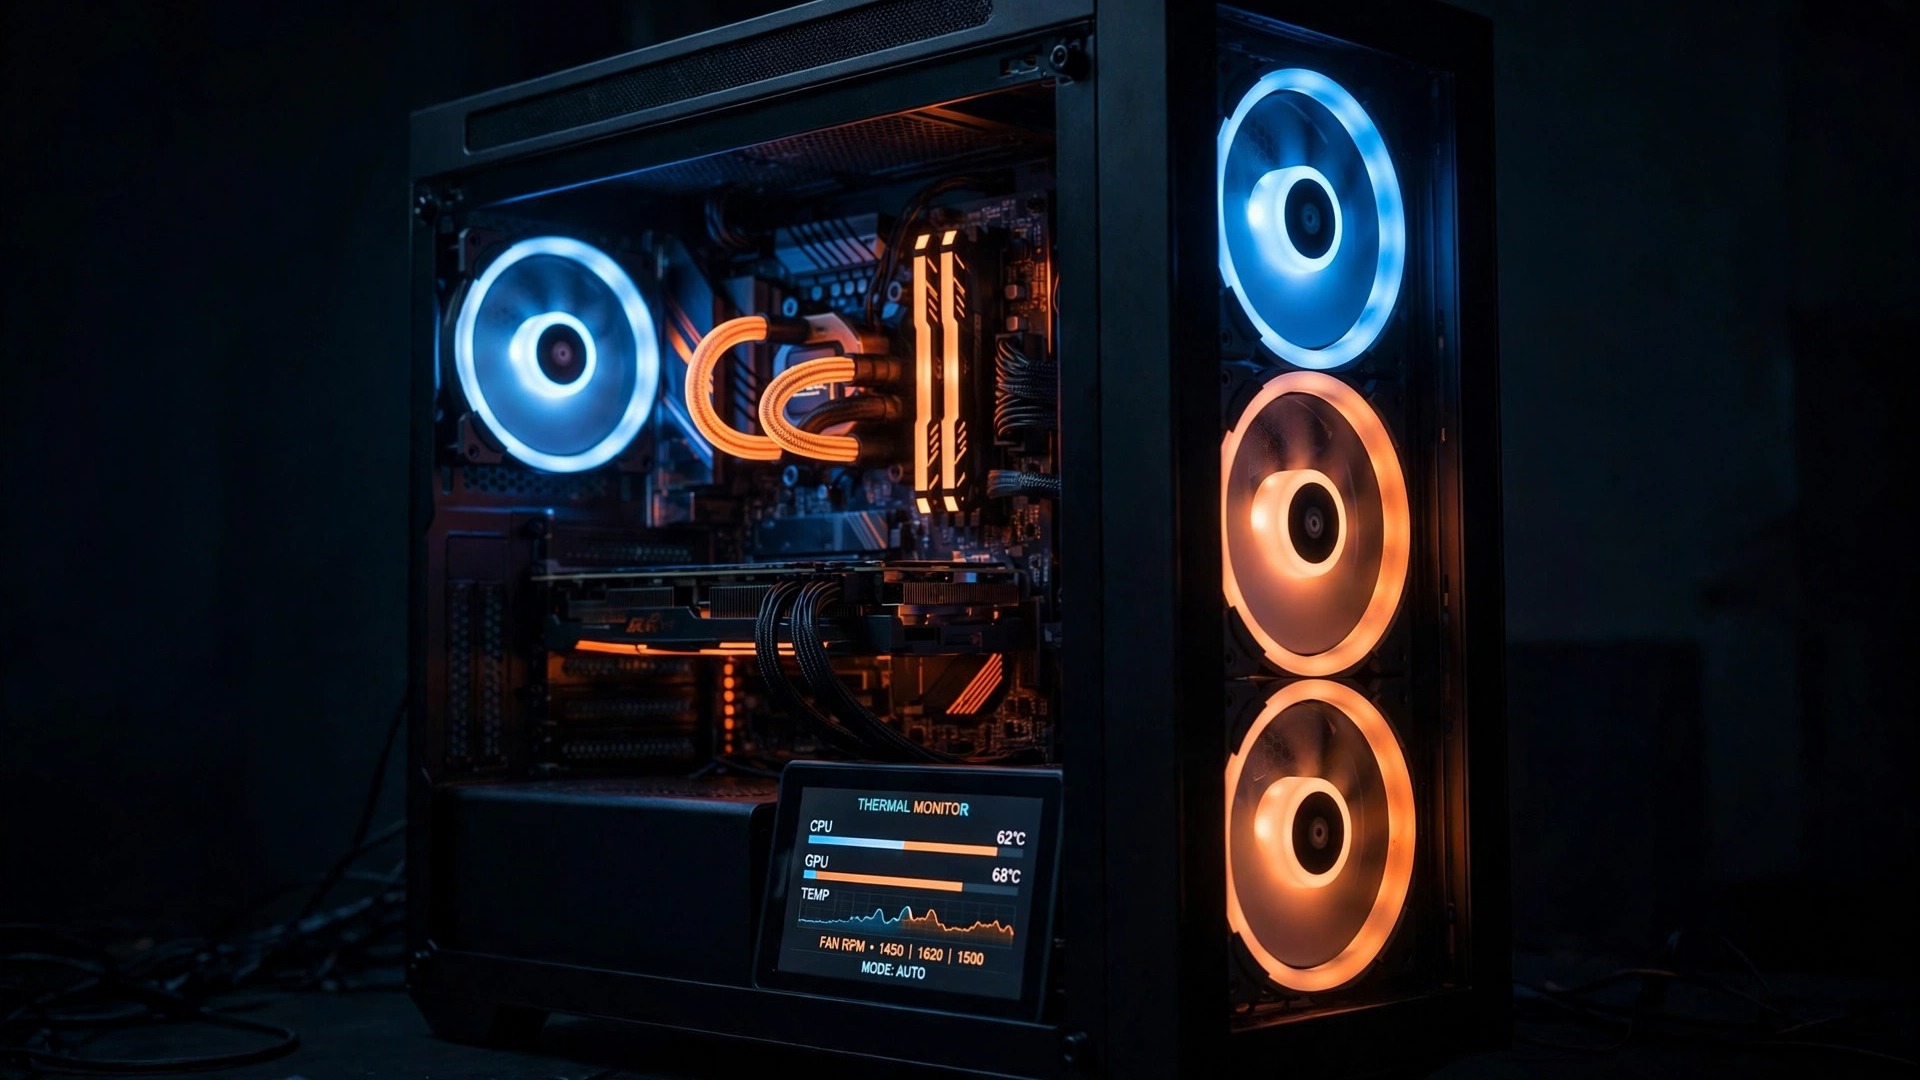
Heat is the quiet performance killer on PC. When your processor or graphics card gets too hot, it protects itself by slowing down — a process called thermal throttling — and the only symptom you notice is a game that suddenly stutters, drops frames, or crashes to the desktop. The good news: checking your temperatures while gaming takes a few minutes with free tools, and the numbers immediately tell you whether heat is your problem or whether you should look elsewhere. Below are the three methods worth knowing, from the quickest glance to the full diagnostic view.
Why temperature matters while gaming
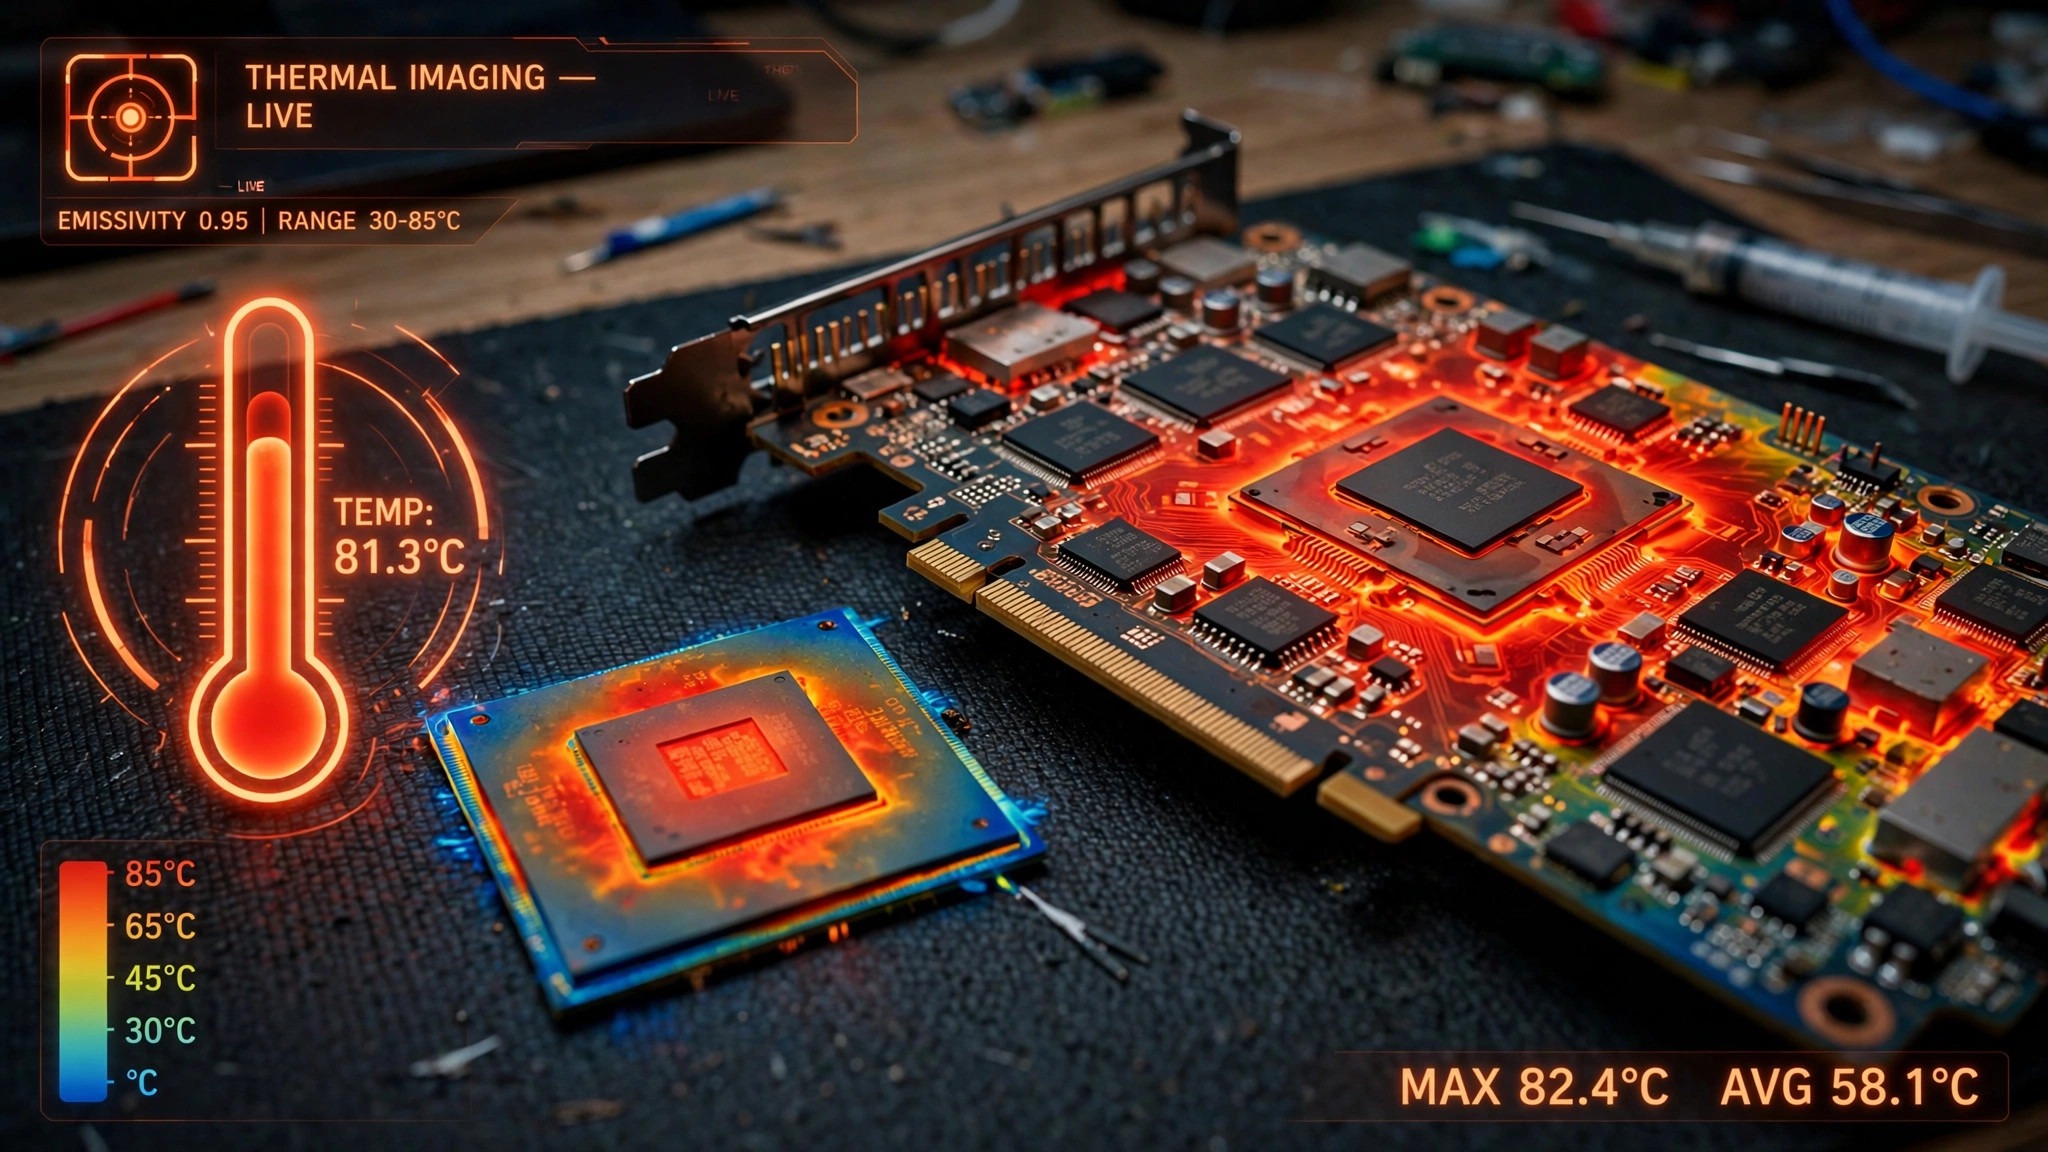
Modern CPUs and GPUs constantly balance clock speed against heat. As long as temperatures stay within their designed range, the chip boosts as high as power and cooling allow. Once heat crosses a threshold — typically around 95–100°C for desktop CPUs and 83–93°C for GPUs, depending on the model — the chip cuts its clock speed to cool down. You feel that as sudden frame drops in the middle of a smooth session, stutter that appears after twenty minutes of play, or fans spinning up to full speed and staying there.
Temperature readings are also the fastest way to narrow down a problem. If your GPU sits at 78°C while a game stutters, heat is not the cause and you can move on to settings, drivers, or background software. If it is pinned at 91°C, you have found your culprit before touching a single setting. That is why a temperature check belongs near the top of any performance troubleshooting routine.
Safe temperature ranges for CPUs and GPUs
There is no single "correct" number — it depends on your chip, your cooler, your case airflow, and the room temperature. But these ranges cover the vast majority of desktop hardware:
| Component | Idle | While gaming | Time to act |
|---|---|---|---|
| Desktop CPU | 35–50°C | 65–80°C | Sustained 85°C and above |
| Desktop GPU (main reading) | 30–45°C | 65–85°C | Sustained 88°C and above |
| GPU hotspot (hottest sensor) | — | 75–95°C | 105°C and above |
A few notes on reading this table. Brief spikes above these ranges are normal — what matters is the sustained temperature during a long session. AMD graphics cards report a separate "hotspot" temperature that runs 10–20°C hotter than the main GPU reading; some models are rated for hotspots up to 110°C, so check your card's specification before worrying. Gaming laptops run hotter by design, and a laptop CPU holding 85–95°C under load is often completely normal — thin chassis, shared heat pipes, and aggressive boost behaviour all push temperatures up.
The real red lines: a desktop CPU repeatedly hitting 95–100°C will throttle hard and can shut the PC down, and any sustained reading that keeps climbing instead of levelling off means your cooling cannot keep up with the heat being produced.
Method 1: the 10-second check in Task Manager
If you just want a quick GPU temperature reading, Windows already has you covered:
- Press
Ctrl + Shift + Escto open Task Manager. - Switch to the Performance tab and select GPU on the left.
- The current GPU temperature appears near the bottom of the panel.
This works on Windows 10 and 11 with reasonably recent graphics drivers. The limitations: it shows the GPU only, not the CPU, and you cannot see it while a fullscreen game is running — you have to alt-tab out, which means you are reading the temperature a few seconds after the load stopped. Fine for a spot check, not enough for real monitoring.
Method 2: the in-game overlay with MSI Afterburner
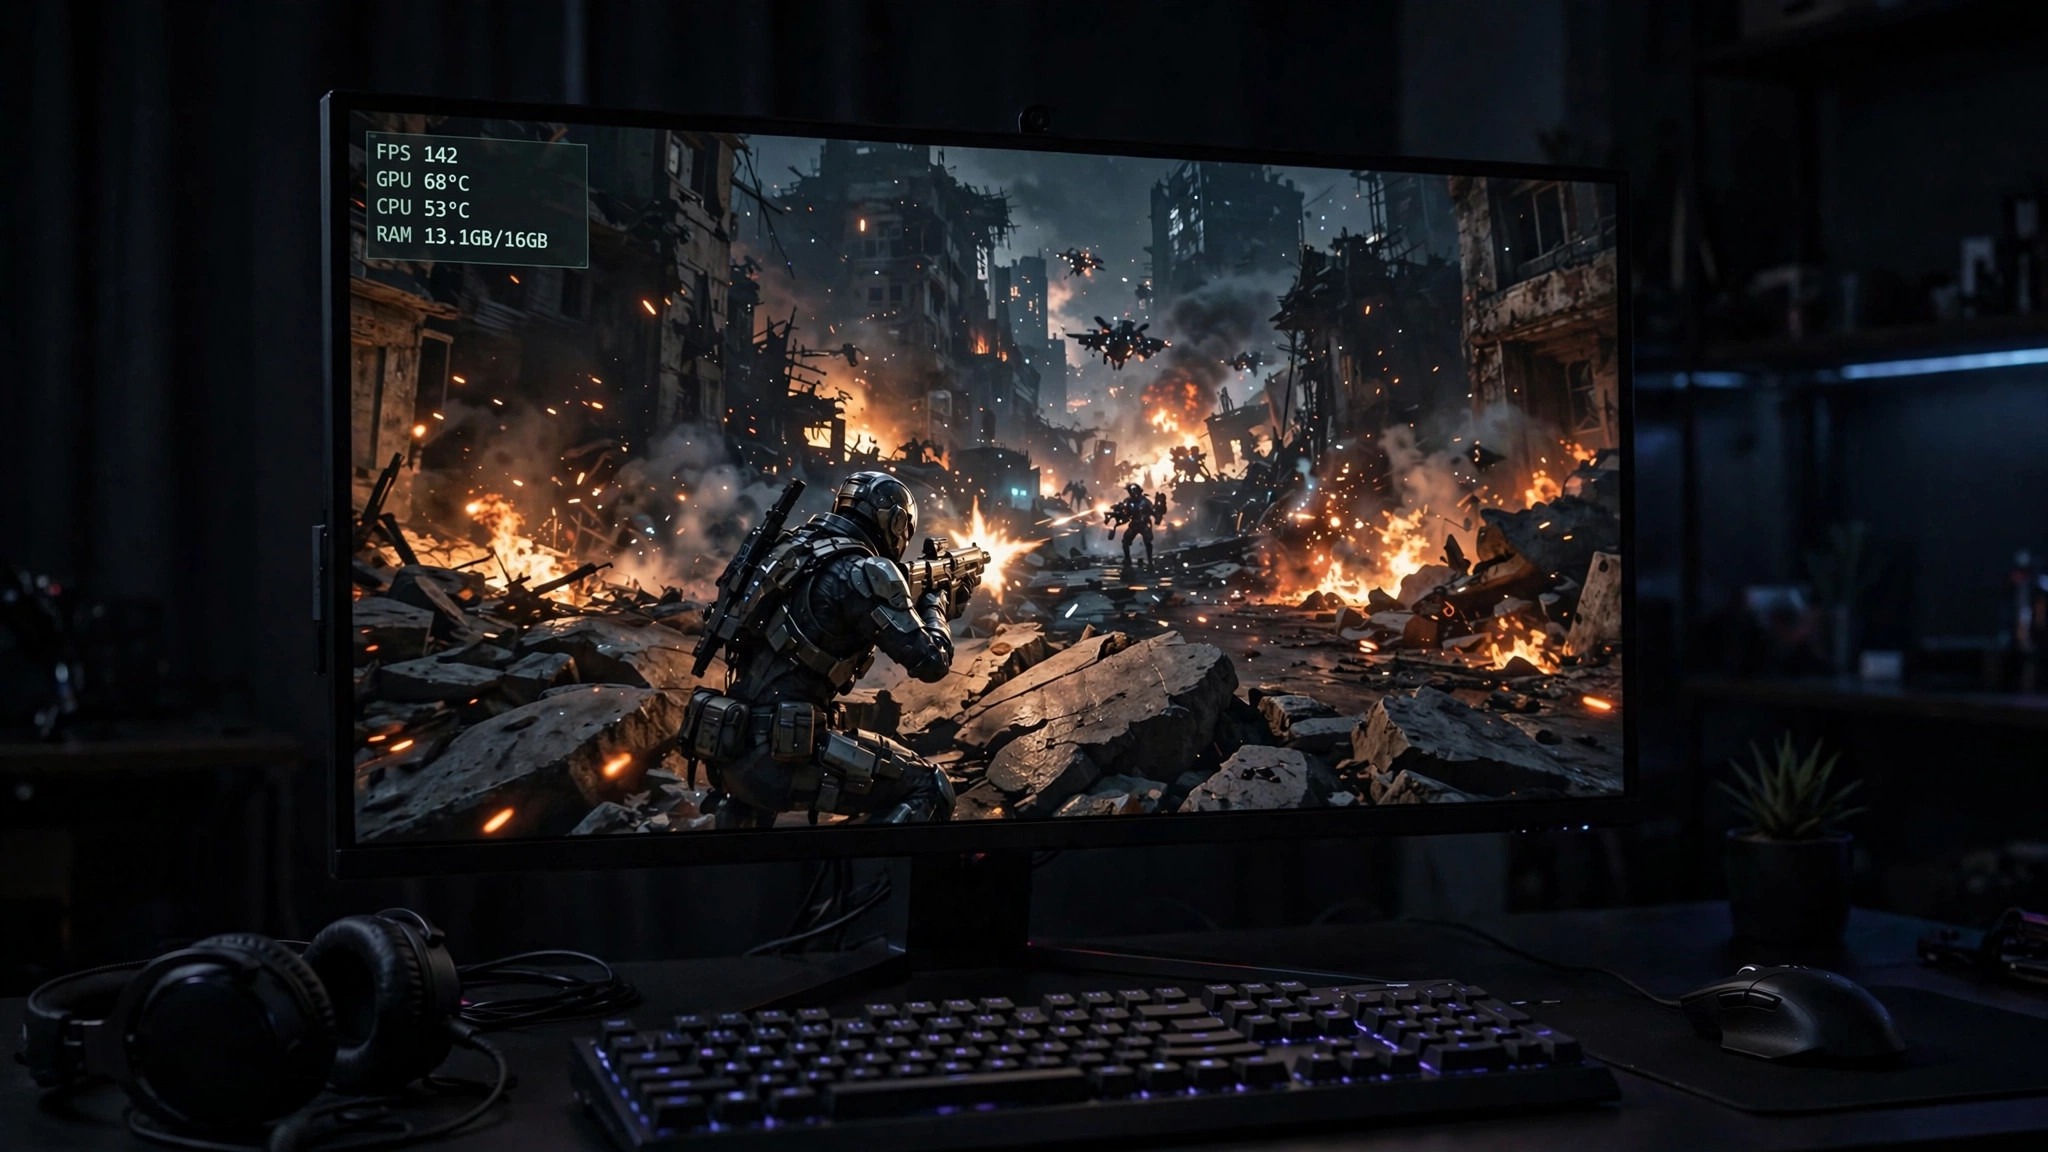
The best way to watch temperatures while you play is an on-screen overlay, and the standard free tool is MSI Afterburner. Despite the name, it works with graphics cards from any manufacturer, and it installs RivaTuner Statistics Server alongside itself to draw the overlay.
- Download MSI Afterburner from MSI's official website and install it, leaving the RivaTuner Statistics Server component checked.
- Open Afterburner and click the gear icon to open Settings, then go to the Monitoring tab.
- In the list, tick GPU temperature and CPU temperature — and add GPU usage and Framerate too, since context makes the numbers far more useful.
- Select each ticked item and check Show in On-Screen Display below the list.
- Under the On-Screen Display tab, set a Toggle On-Screen Display hotkey so you can show or hide the overlay in game.
- Launch your game. The overlay appears in the corner you chose, updating live.
Afterburner can also draw a temperature graph over time, which is handy for spotting the moment a long session starts throttling. And since the overlay already shows your frame rate, pair it with our guide to showing FPS in any PC game if you want every built-in and free frame-rate method in one place.
Method 3: the full diagnostic view with HWiNFO
When you need detail — per-core CPU temperatures, GPU hotspot readings, fan speeds, voltages — HWiNFO64 is the tool. It is free, it runs in portable mode without installing, and it reads nearly every sensor in your system.
- Download HWiNFO and launch it, choosing Sensors-only mode.
- Scroll the sensors window: look for CPU Package (Intel) or CPU (Tctl/Tdie) (AMD) for the processor, and GPU Temperature plus GPU Hot Spot Temperature for the graphics card.
- Play for 15–20 minutes with the window on a second monitor, or use the logging button to record every sensor to a CSV file you can review afterwards.
HWiNFO is the right choice when Afterburner's handful of numbers is not enough — for example, when one CPU core runs far hotter than the rest (a hint at a badly mounted cooler) or when you want to confirm that fan speeds actually ramp up with temperature.
What to do if your temperatures are too high
High readings are a cooling problem, not a settings problem, so the fixes are physical:
- Clean the dust. Clogged dust filters, heatsink fins, and fans are the most common cause of creeping temperatures. Power the PC off and clean them with compressed air.
- Check your fan curves. In Afterburner (GPU) or your motherboard BIOS (case and CPU fans), make sure fans actually ramp up under load — a "silent" profile can let temperatures run away.
- Improve case airflow. Intake at the front and bottom, exhaust at the rear and top, with no tangle of cables blocking the path between them.
- Reposition a laptop. Elevate the rear for airflow, clean the vents, and use a cooling pad for long sessions — never game with a laptop on a bed or blanket.
- Consider undervolting. Reducing voltage slightly can cut temperatures by several degrees with no performance loss, though it takes careful stability testing.
- Repaste as a last resort. If a card or cooler is several years old and everything else checks out, dried thermal paste may be the cause — but opening up a GPU can void warranties, so treat it as the final option.
If your temperatures are healthy but games still stutter, heat is ruled out — work through our guide on fixing lag and stutter in PC games instead.
Quick answers
- What is a normal CPU temperature while gaming? 65–80°C on a desktop; investigate sustained readings above 85°C.
- What is a normal GPU temperature while gaming? 65–85°C; investigate sustained readings above 88°C.
- Can I check temperatures without installing anything? Yes — Task Manager shows your GPU temperature, but not the CPU.
- Do I need to worry about brief spikes to 90°C? No. Brief spikes are normal; sustained high temperatures are the problem.
- Why does my laptop run so much hotter than my desktop? Thin chassis and shared cooling — 85–95°C under load is normal for many gaming laptops.